How It All Started
Shark tagging can be highly sensationalized, and most people know the gist of what shark tagging is and a basic idea of why it’s done. Shark Week typically shows at least one show every 2 hours that involves someone tagging a shark for research purposes, giving most people that baseline understanding of what shark tagging involves. Back in 2018, while working the summer at the Navarre Beach Marine Science Station, I was shown a relatively small picture of a cute activity the Sandoway Discovery Center created for Jr. Biologist’s at their facility. Naturally with my passion for sharks and general knowledge of shark tagging, I was tasked with building this activity at NBMSS to fit a variety of students and would eventually become a constantly evolving presence in my professional life, and has gone from a basic data collection activity into an immerse, data analysis experience that my students have enjoyed participating in.
Shark Tagging Basics
The process of shark tagging in theory is relatively simple: catch a shark, measure a shark, take samples from the shark, tag the shark, send the shark on its way. Of course, there is much more that goes into the process than just that, but these activities are the general framework for the process. OCEARCH is one of the most popular, public facing organizations that tags sharks and puts the basic movement pattern data onto an app for everyone else to view and track. Back in 2014, this was a thrilling experience for most people watching sharks like Mary Lee pass by their state and last year a shark named Breton made the vague shape of a shark silhouette with his movements causing an uproar in how adorable that was. The idea of shark tracking has always been a fun experience for many people, they sell bracelets and stuffed animals that come with a special code that allows you to track a shark, you can also “adopt” tagged sharks and support various institutions that research sharks. While most tagging for research is more in depth and obtains a lot more information on the shark than just its movement patterns, these sites are a great way to introduce shark tagging to the public and show how much of the data and information we learn about sharks comes from activities like this.
First Iteration
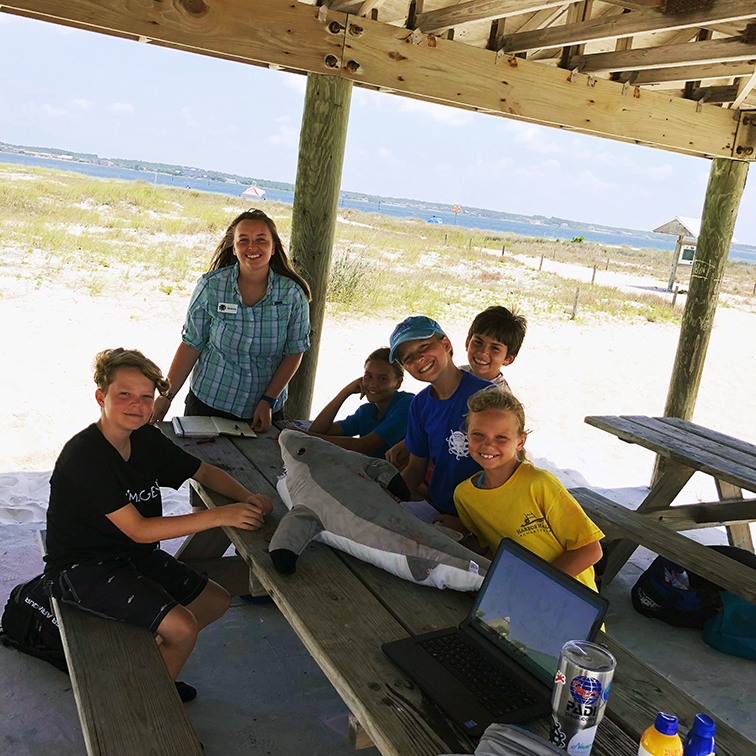
When I first took the idea of a shark tagging activity and revamped it, I started with just the tagging process itself. I used large stuffed sharks and sewed magnets into their fins and Velcro into their mouths to create a shark that was fit to complete all the processes of shark tagging on. The shark tag was made of a fishing line buoy. I drew scars on their bodies and put laminated fish into their mouths to simulate stomach contents. It was rough, raw, and super fun to make; but it did take a very long time to make several of these sharks for use in summer camps and classroom activities. I took a data sheet from what I could find online for shark tagging and revamped it to fit what I had created. We measured the fork and total length, looked at the stomach contents of the shark, weighed it, even named it. The kids would spend several minutes thinking about the perfect name for the shark and typically it would become “Bob”. After going through the process of tagging the shark we would sit down and look at the OCEARCH site to find out more about tagging and follow shark tracks in the local waters.
Second Iteration
This activity is still being taught at the Navarre Beach Marine Science Station during class field trips and camps, but since then I have upgraded the activity with the help of my very tech savvy husband to make the whole process much more interactive and science driven. In our discussions on how we could build on and improve the tagging experience, we added a couple upgrades to the stuffed sharks like a blood sample mechanism the kids could draw “blood” from. But really, we wanted more data in this activity and took some time experimenting with different ways to accomplish this.
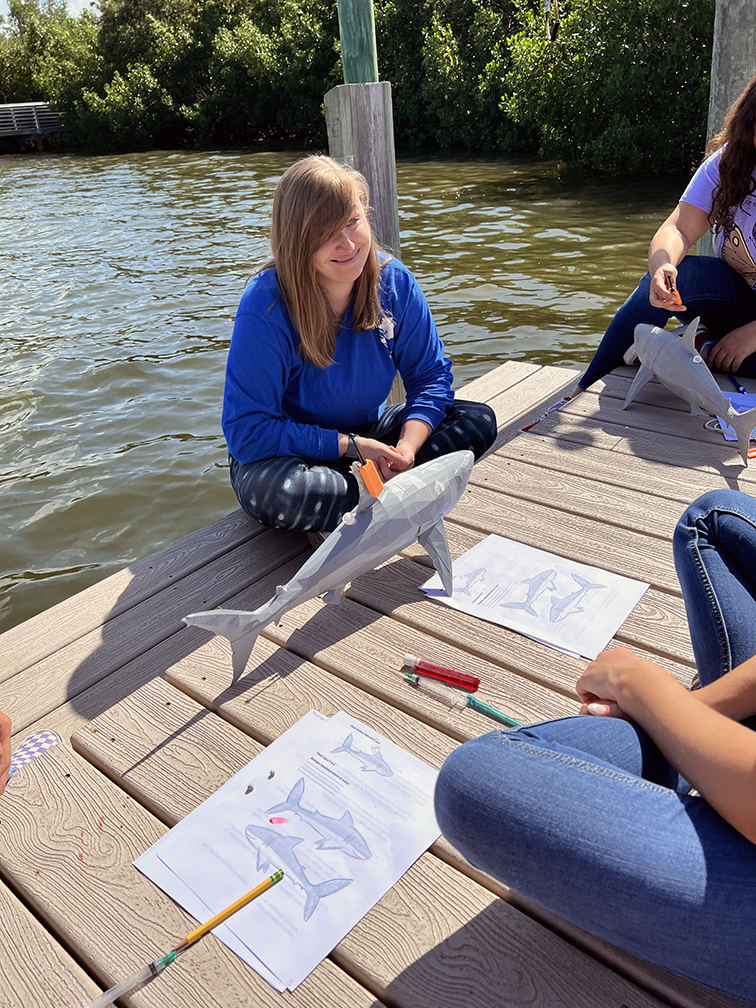
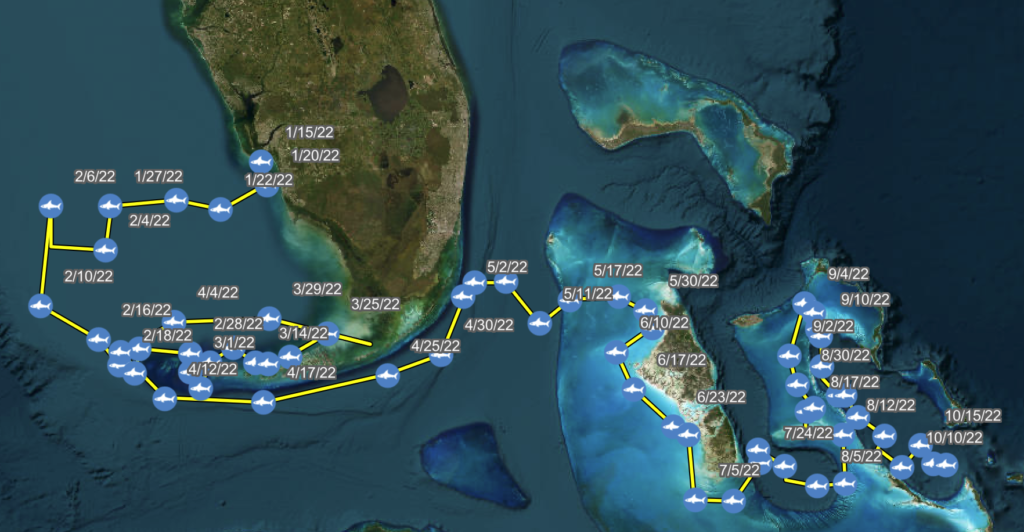
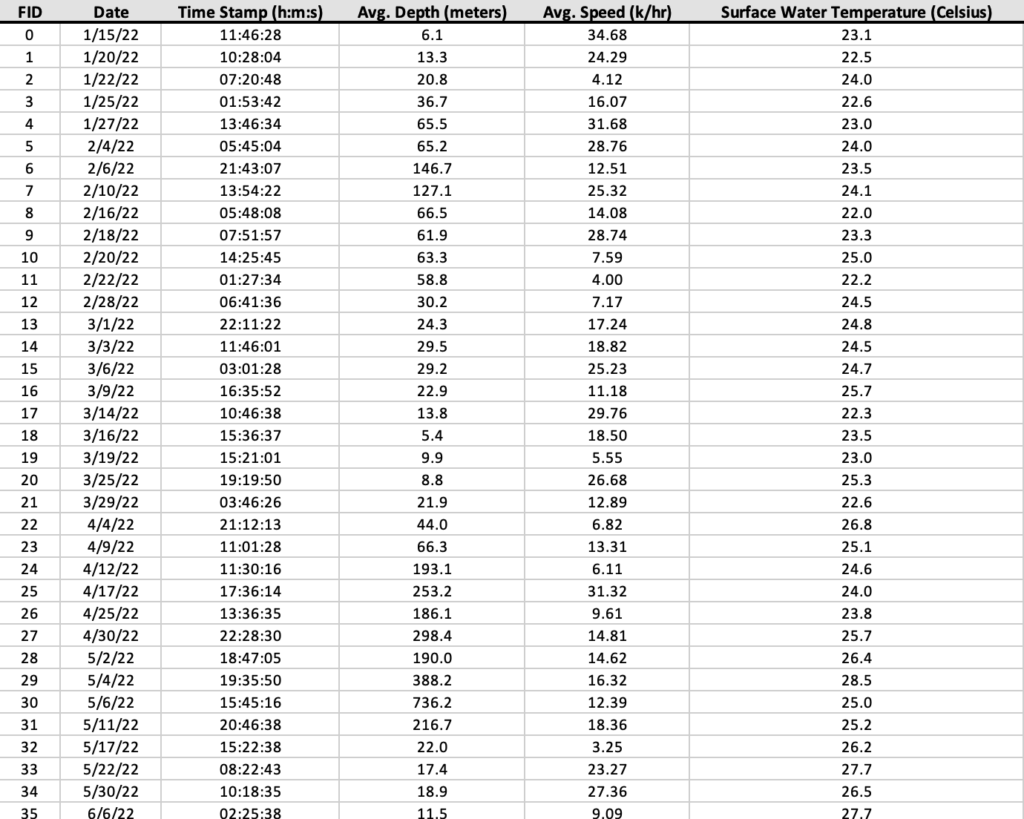
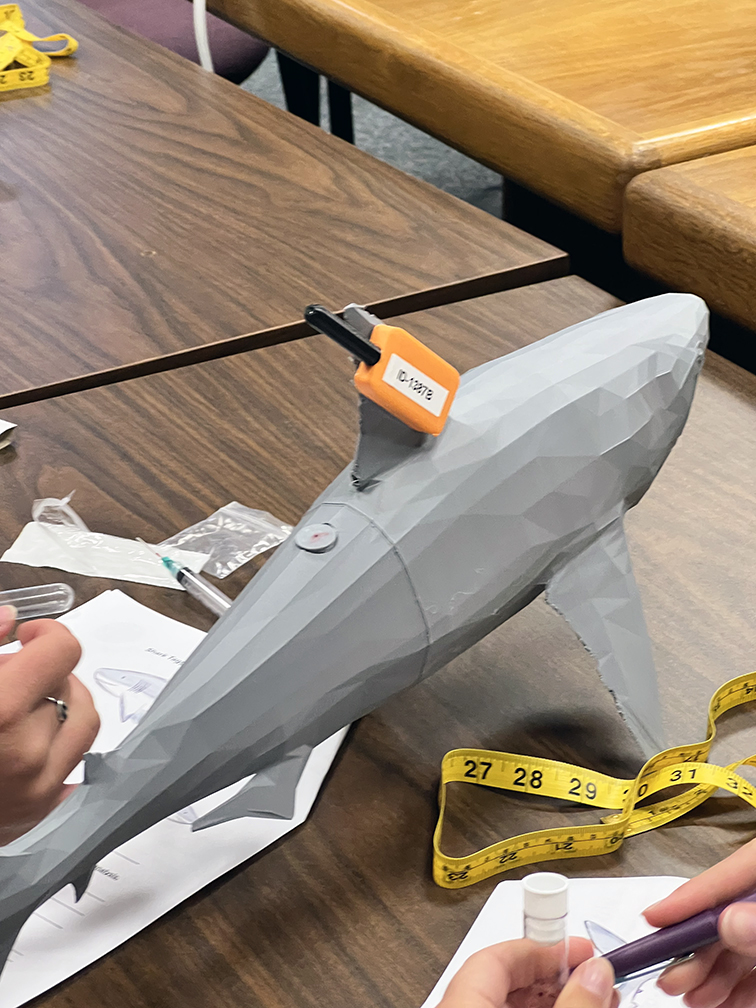
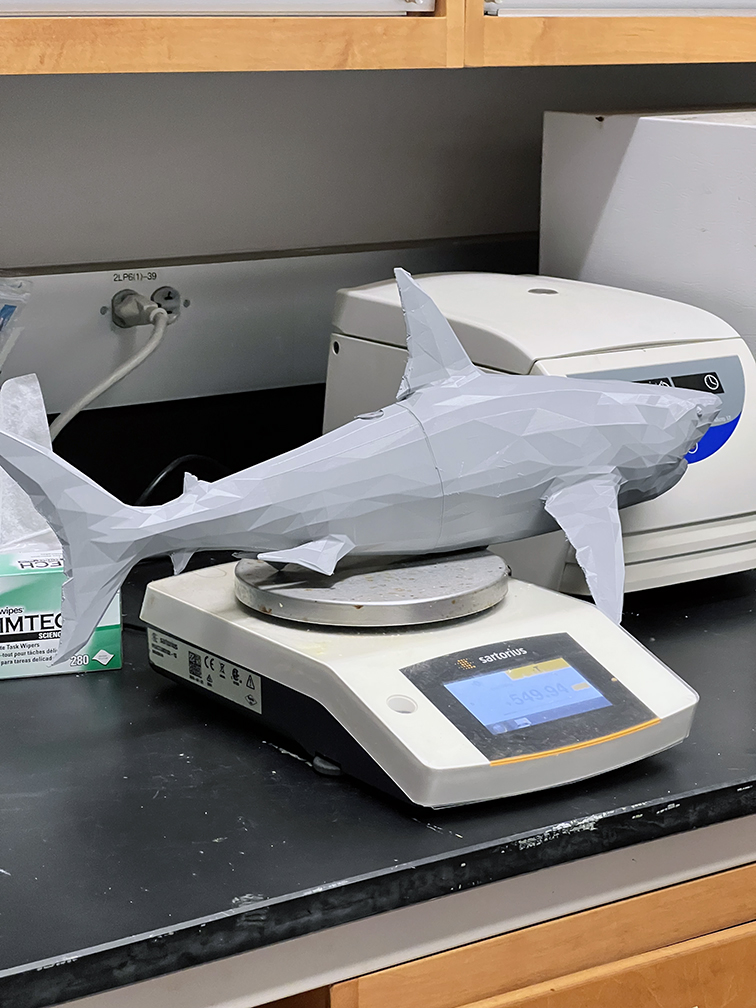
We revamped the whole activity, keeping the main tagging segment the same but changing the shark to be a 3D printed model shark that we could add special compartments to. We built a new tag that fit right to the shark’s fin without any clunky outside magnets, and we built a map using mapping software to show where the shark went on its travels after the students tagged the shark. In 2022 this was randomized data we came up with that wasn’t perfect for answering research questions in the activity but worked for the time. The students were able to graph some basic oceanographic concepts like depth vs. temperature, pressure vs. depth, etc. based on the data they got from the tag. The tags contained a micro-SD card slot holder that could be removed and put into a computer for data reading and analysis in Excel and on Google Earth. This was a hit with the students as they were able to experience being a scientist and graphing and inputting data into processors to figure out the shark’s habits and lifestyle. But of course, we could do better. Naturally, the activity evolved even more for the next year.

Latest Iteration
After the 2022 University of South Florida’s Oceanography Camp for Girls shark lab, we noticed some hiccups and general issues that could be easily streamlined to make it simpler and more enjoyable for the students. First was removing the micro-SD card and replacing it with an RFID tag that could transmit to the students’ phones. This, of course, was incredible for the students to witness. They had an ArcGIS map of their specific shark’s path that could be broken down into data points that included the shark’s depth, speed, and the exact coordinates of the shark’s location.
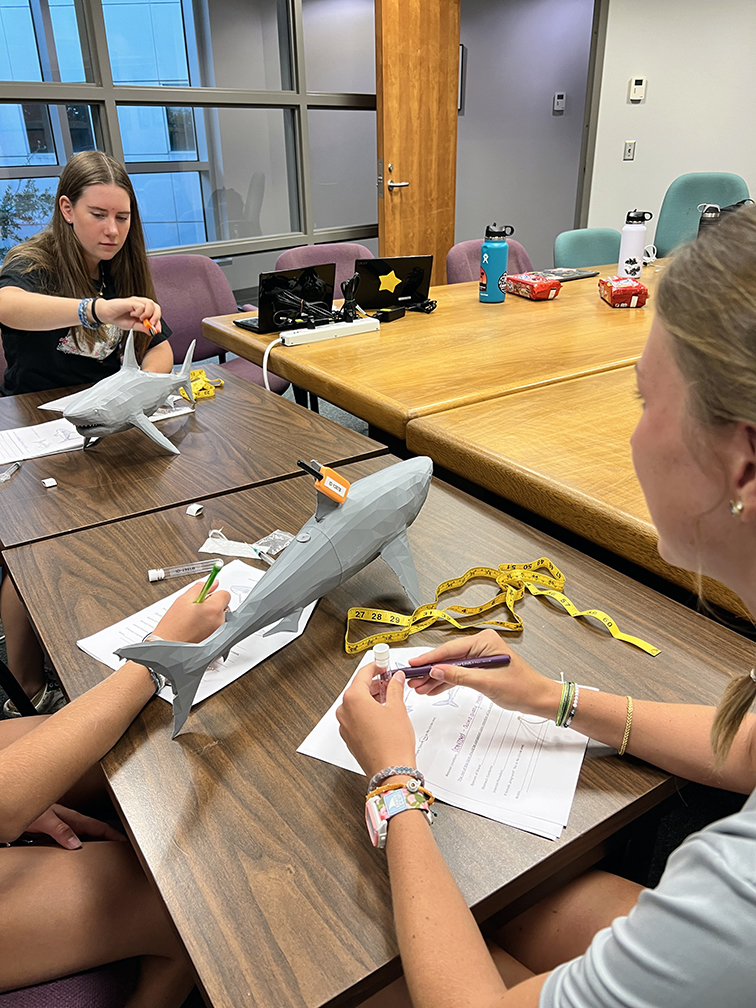
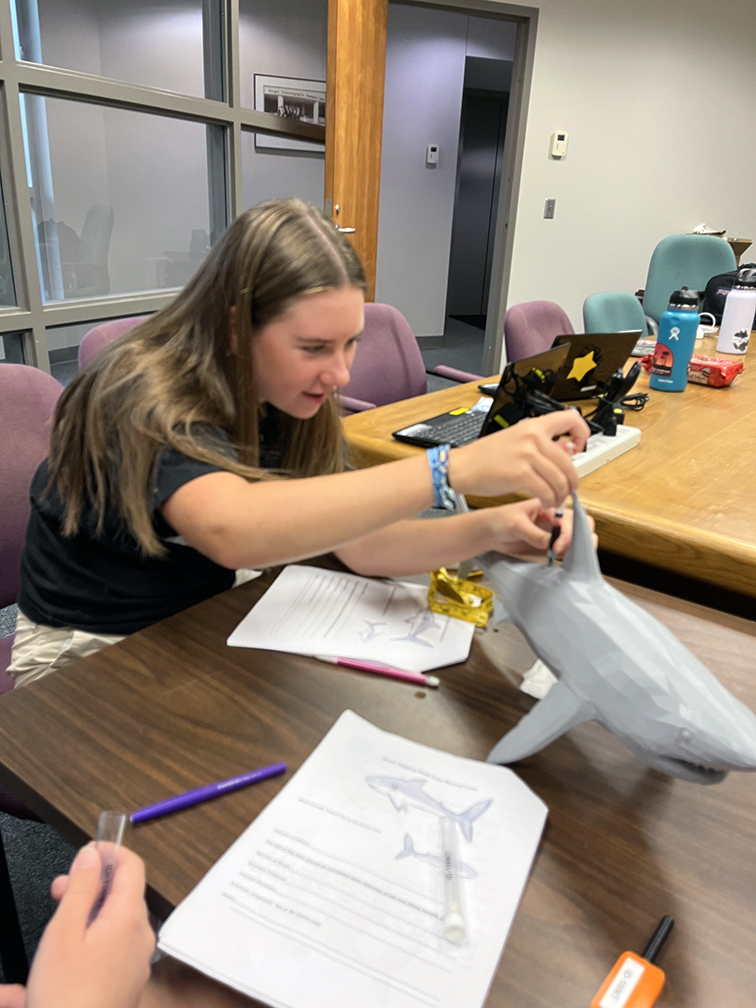
We also modeled the two sharks into totally different species, each with a different life history and movement pattern. The first shark was a juvenile bull shark, with low progesterone levels and a heavily estuary and bay-based movement pattern. The other shark was an adult pregnant tiger shark with high progesterone levels indicating phase of pregnancy and a movement pattern centered around the Bahamas. Each shark’s progesterone level indicates the stage of life the shark was in, this data came from the “blood sample” along with an analysis of the stomach contents of the shark at the time it was caught. We also streamlined the gathering of this data by creating a “blood sample analyzer” that held the test tubes and gave a green light when complete, the students would then be able to use their phones to gather the data from the blood analysis via another RFID tag. The students found this method to be easy to manipulate, so long as they had the proper computers and phones.
We worked out how to graph speed and depth to determine the shark’s pattern of movement and feeding/hunting habits in the areas they were frequenting. We also added research questions for the students to consider while they were examining the data which challenged them to think critically about why the sharks were in an area and how we can better protect the sharks when they are in these regions. The main focus of using the ArcGIS map and the recorded speed and depth data is to get the students to go through the process of proposing a Marine Protected Area for each species of shark. The students learned about the process of determining the best location for Marine Protected Areas by analyzing the shark data gathered and finding the areas on the map that may correlate to critically important aspects of the sharks’ lifecycle. In the case of our bull sharks, the students tended to find that the estuary of Tampa Bay should be protected due to it being a protected region for juvenile sharks to grow up. For the tiger shark, the students found that the heavily pregnant shark slowed down and hung around Nassau, Bahamas likely to pup. The addition of MPA’s to the lab gave students a real-world connection and a socioscientific approach to shark tagging, showing the students the implications of gathering data from tagging different species of sharks.
What’s To Come…
This activity is constantly evolving and adapting as I continue to teach this activity and get feedback from my students and other educators who use this lesson. I’m very interested in feedback and implement these ideas into the next iteration of the lab. I am proud of the work that we put into this lab and the updates made to make it engaging and interactive for the students. For now, I believe we have a solid framework. This lab incorporates experiential and socioscientific learning that is ideal for both formal and informal education settings and gets students engaged in the scientific process of gathering data and making informed decisions.
This is just the beginning! This site will contain updates on this activity and information for how this lesson can be incorporated into a variety of educational settings. Hopefully this will bring some joy and inspiration to science students!
